One of the projects I’m working on at Monell involves looking for patterns between body odors and health status. Since the time of Hippocrates, body odor has been used to help with the diagnosis of illness. At Monell, we are using analytical chemistry techniques and behavioral bioassays to figure out which individual volatile compounds or groups of compounds might help us to predict when an animal (or maybe even a person!) is in poor health or good health. In the animal world, individuals use information encoded in odors to decide who they interact with… it might not be such a good idea to get cozy with a sick animal, especially if they are contagious. But what about if they are not sick, but are under conditions of stress? Can animals tell when others are being affected by chronic stress?
Recently, I have discovered that several of the well-known pheromones produced by male mice to attract mates and compete with other male mice are downregulated during illness (inflammation) and during exposure to chronic stress. In other words, male mice smell less attractive and less dominant when they are experiencing negative physiological challenges like illness or stress, or a combination of both. As of now, it is unclear whether this same phenomenon might occur in humans.
Below, is an example. The compound DHB, or dehydro-exo-brevicomin, is produced in the urine of male mice (and older mice seem to produce more of this compound). DHB, and synthetic analogs of DHB have have been shown in previous studies to increase inter-male aggression, accelerate puberty and induce estrus in female mice, and lure female mice toward prospective mates. We used an experiment to see how DHB levels changed in mice who were sick, stressed, or sick and stressed, in comparison to healthy control mice. Below you can see some preliminary results with respect to this single pheromone compound…
Time is the x-axis: it represents days that we sampled urine from mice, starting at day 0, before the experiment (before mice were sick or stressed, if they were assigned to those treatments).
DHB “peak response” is the y-axis: it represents the height of the chromatographic peak produced by headspace analysis using gas chromatography/mass spectrometry (a chemical method where we take all of the volatile odorants above a liquid, separate them, and identify them, one-by-one).
# load up ggplot:
library(ggplot2)

# read in my file:
urine <- read.csv("urine.csv")

# Rename treatment levels so that they are more intuitive in the plot:
levels(urine$Treatment) <- c("Healthy", "Stressed", "Stressed & Sick", "Sick")

# The basic plot setup:
### Note: X37 means "peak 37", or the 37th peak in the chromatogram that we get from our GC/MS (chemical) analysis, which we know (from a lot of work involving spectral matching) corresponds to the pheromone, DHB!

DHBplot <- ggplot(urine, aes(x=Day,y=log(X37))) + geom_point() + geom_smooth(method="lm") + facet_grid(~Treatment)

# Some customization to the individual/faceted sub-plots for each treatment:

DHBplot <- DHBplot + theme_bw() + facet_grid(~Treatment) +
  theme(strip.text.x = element_text(size=12, face = "bold"),
        strip.text.y = element_text(size=12, face="bold"))

# Some customization to the whole composite plot:

DHBplot <- DHBplot + labs(y = "Log10 DHB Peak Response Over Time") + theme(axis.title.x = element_text(colour = "black", size = 14, face = "bold"), axis.title.y = element_text(colour = "black", size = 14, face = "bold"), axis.text.x = element_text(colour = "black", size = 10, face = "bold"), axis.text.y = element_text(colour = "black", size = 10, face = "bold"))

# Call the plot:
DHBplot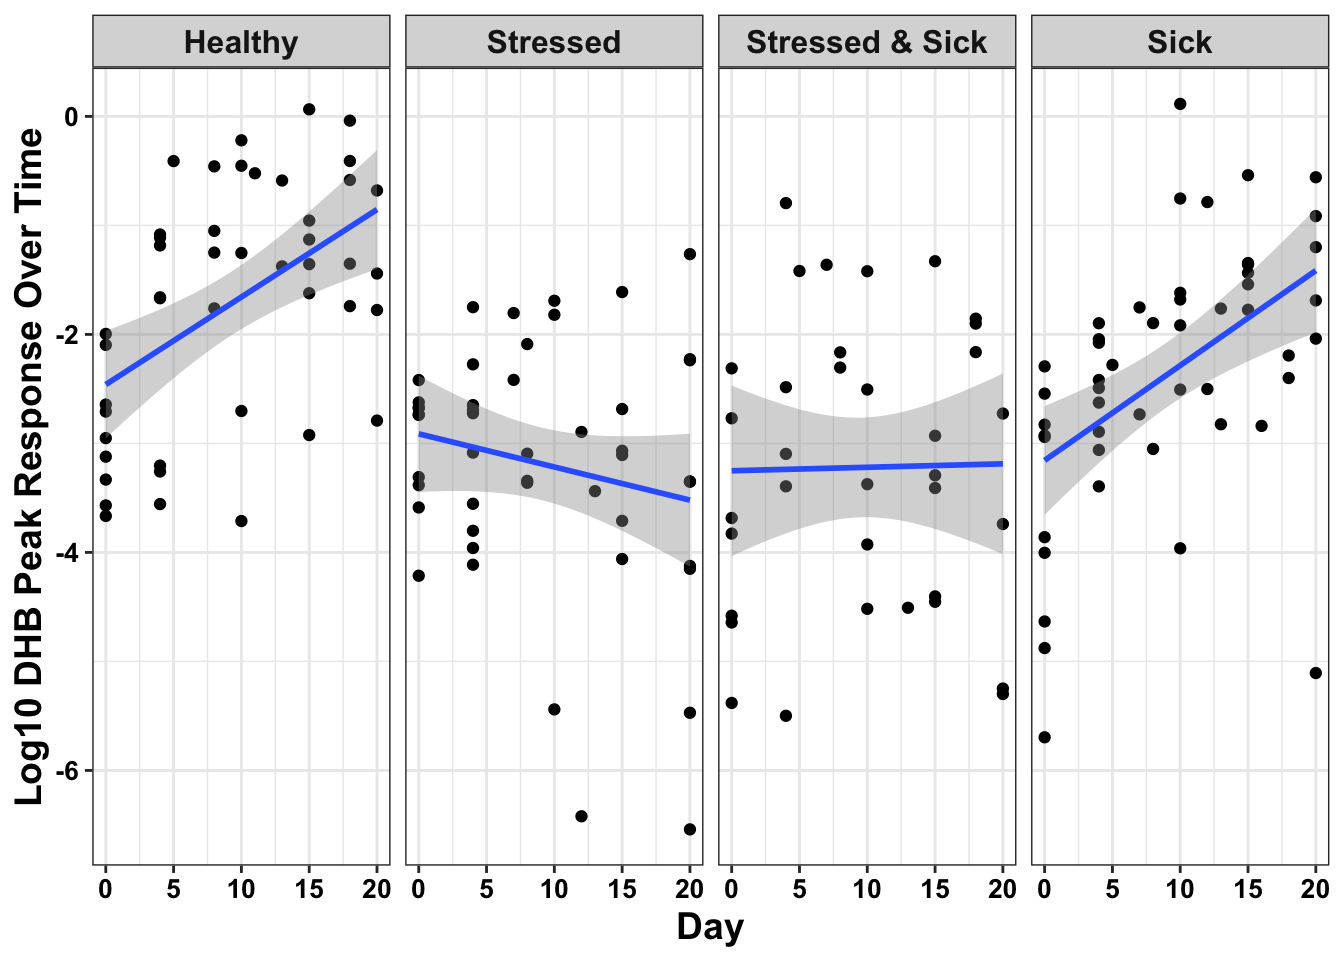
You can see from the output that there’s something different going on with the mice who are stressed or who are sick while also stressed compared to mice in the other treatments. The lines for each treatment have different slopes (our linear mixed models - a type of statistical approach, confirm that these slopes are “significantly different” from each other). It looks like all of the mice have similar DHB levels before the start of the experiment (day 0), but over time (or, as the mice mature), healthy mice and sick mice produce higher and higher levels of the pheromone. Stress, or more specifically in this case, chronic stress, appears to suppress this increase. Why might this be? We are thinking a lot about this as we write up our manuscript!